Analyse
SQL against high-volume transaction data, then finding the pattern that actually explains the alert rather than the one that looks tidy.
Open to data science & analytics roles
Hello, I'm
A Data analyst, Engineer and Applied ML researcher.
I spend my days on financial-crime analytics at SEBPO: SQL against high-volume transaction data, and the Power BI reporting that compliance teams run their week from. The rest of my time goes to deep learning — road accident classification from CCTV, now under review at ICCIT 2026, and a study on how fraud models rot as behaviour shifts.
 Dhaka, BD
About
SQL against high-volume transaction data, then finding the pattern that actually explains the alert rather than the one that looks tidy.
Power BI reports and automated pipelines that a compliance team opens every morning, not dashboards nobody asked for.
Deep learning on problems with messy real-world data: accident detection from CCTV, and model decay in fraud systems.
I work as a data analyst at ServiceEngine Limited (SEBPO) in Dhaka, on a team doing compliance analytics for financial-sector clients. Day to day that means SQL against high-volume transaction data, cleaning and reconciling customer records that rarely match cleanly, and building the Power BI dashboards that compliance officers and team leads actually run their week from.
When a screening decision has to survive an audit, you learn to document why the data says what it says, not just what it says.
That habit carried into everything else I build. Before SEBPO I finished a Computer Science degree at Premier University, Chattogram, where my thesis became a deep-learning system for classifying road accidents from CCTV footage. That paper is under review at ICCIT 2026, and I'm now looking at what happens to fraud-detection models when the behaviour underneath them changes.
Toolkit
Grouped by what I reach for, rather than scored out of a hundred.
Experience
ServiceEngine Limited (SEBPO) · Management Analytics & Research Solutions · Dhaka
ServiceEngine Limited (SEBPO) · Dhaka
Mentorness · Remote
HophyCare · Health-tech startup · Bangladesh
Youth School for Social Entrepreneurs (YSSE) · Youth-led non-profit
Enrolled spring 2019; final results published 20 February 2024, the duration extended by the nationwide COVID-19 university closures. Core coursework in machine learning, computer vision, statistics, data structures and algorithms, database systems and software engineering.
Feb 2023 – Feb 2024
IEEE Premier University Student Branch
Second in command of the university's IEEE branch, running the technical event calendar and the volunteer team behind it.
Sep 2022 – Dec 2023
CSE Club, Premier University
Ran the department's student club: membership, meeting cadence and the workshops and contests it put on across the year.
Jan 2022 – Dec 2023
Robotics Club, Premier University
Led the technical side of the robotics club, mentoring junior members through build projects and competition entries.
2022 & 2023
Bangladesh Olympiad in Informatics
Helped run two national programming olympiad rounds hosted at the Premier University CSE department.
2019
Premier University IT Fest
On the organising team for the university's annual technology festival.
Jan 2023 – Present
IEEE · no. 99076130
Also a member of the Leo Club of Chittagong Karnaphuli since December 2022, on community service projects.
Research
Applied machine learning on problems where the data misbehaves: video that has to be labelled by hand, and models that quietly stop working.
Under review · ICCIT 2026
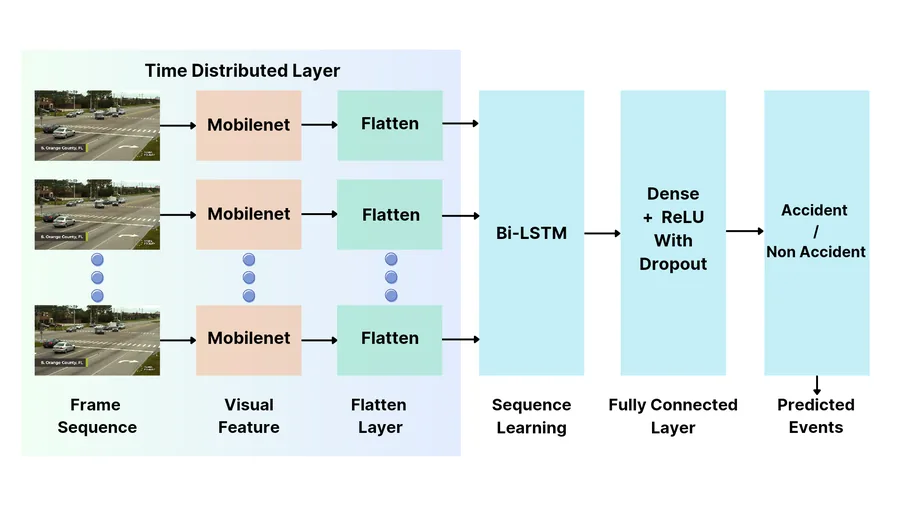
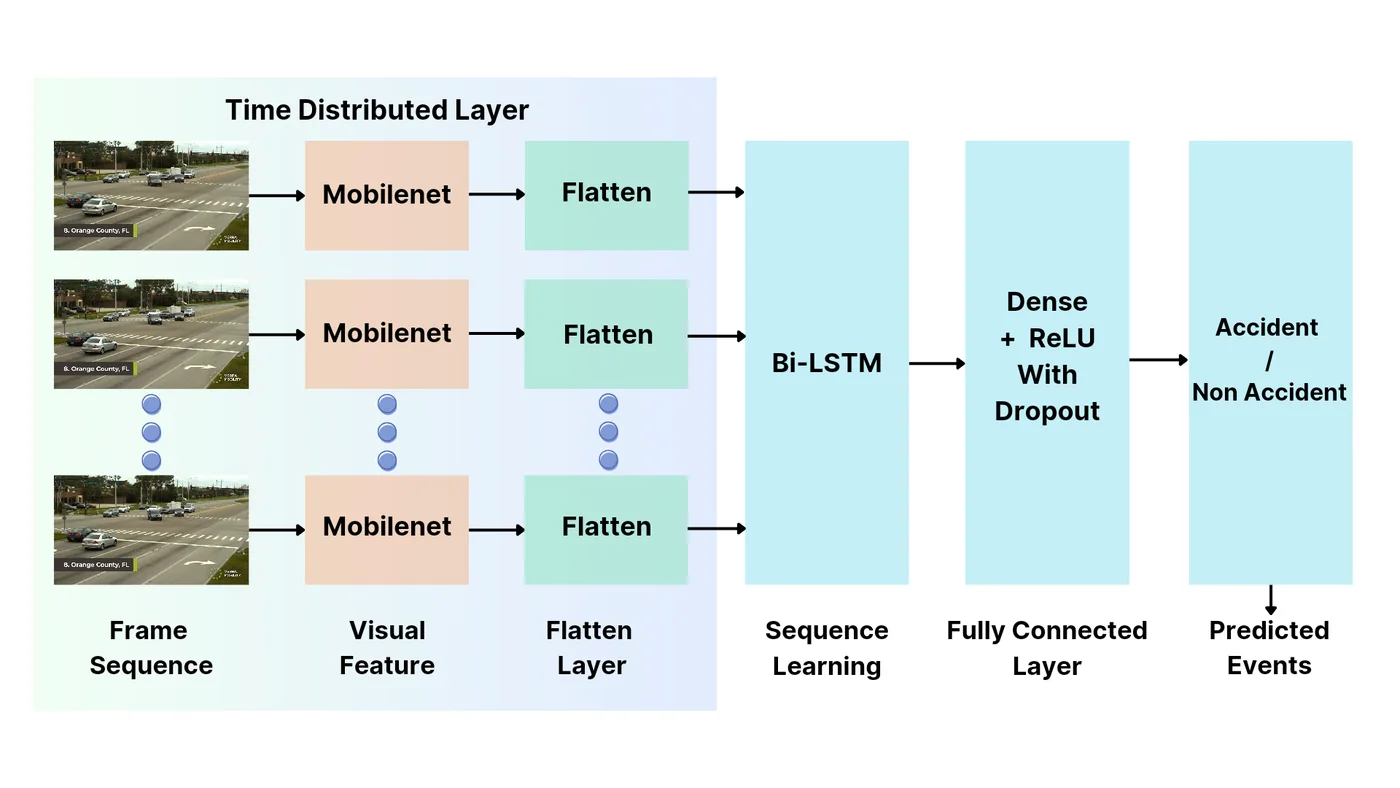
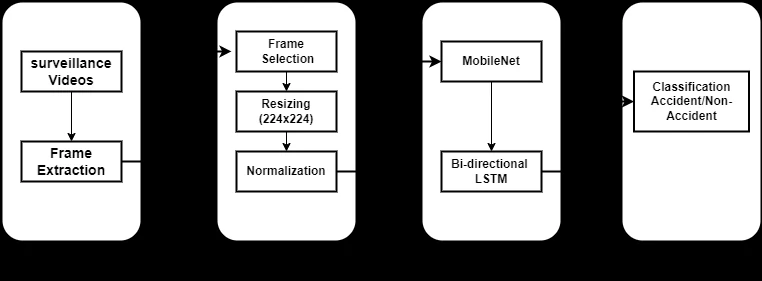
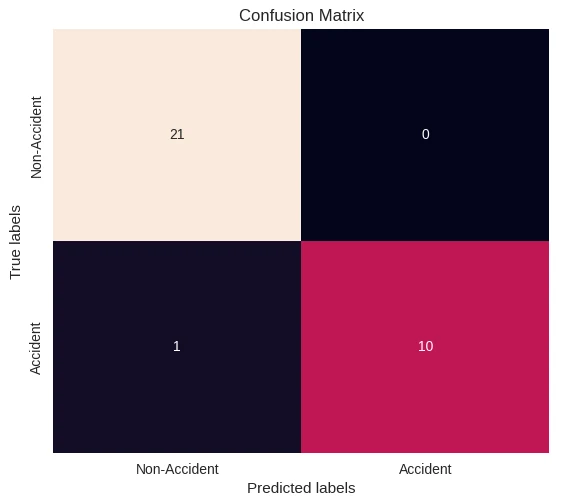
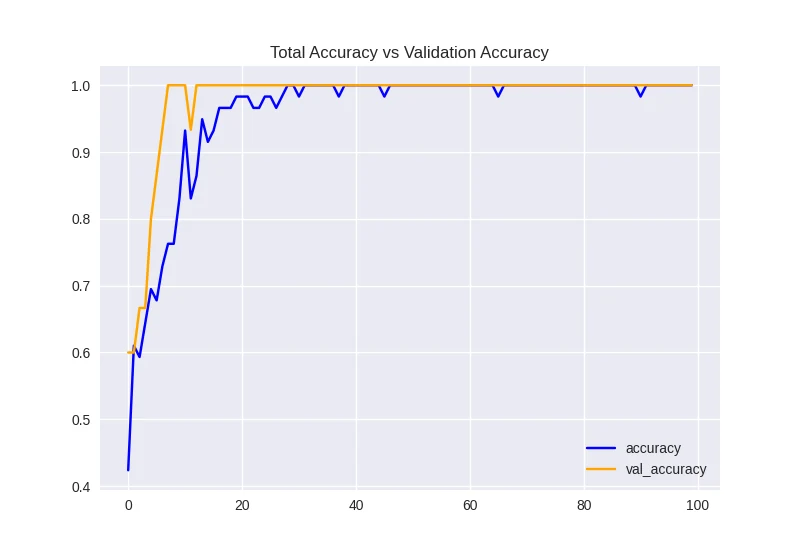
A hybrid deep-learning model that decides whether a stretch of CCTV footage contains a road accident. MobileNetV2 pulls visual features out of each frame, a bidirectional LSTM reads the frames as a sequence, and the pair reach 96.9% accuracy on a dataset we collected ourselves: 126 real surveillance videos, about 1,890 sampled frames. Building the dataset was most of the work, including diagnosing and correcting a daylight sampling bias that was suppressing low-light performance.
In progress
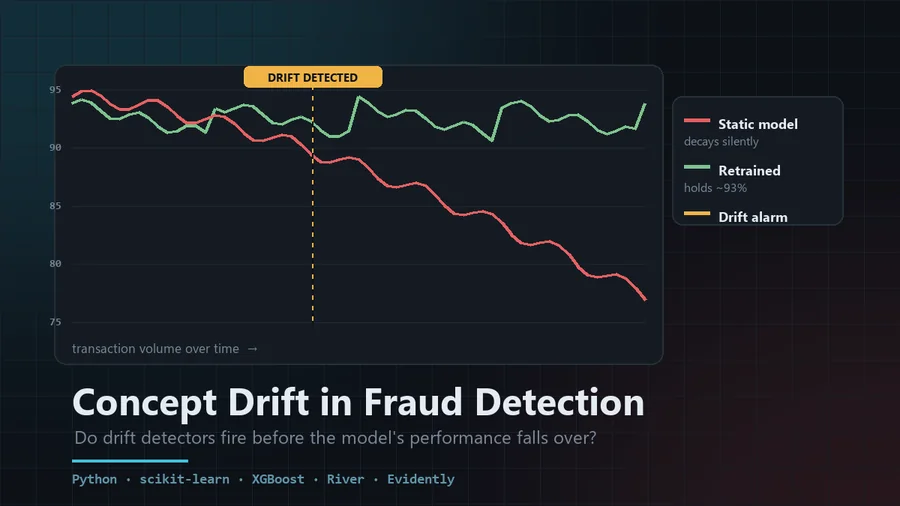
Fraud models are trained once and then quietly decay, because the behaviour they were fitted to keeps moving. This study measures how far a static model falls behind one that is periodically retrained, and whether drift-detection methods raise the alarm before predictive performance has already degraded in a way anyone would notice.
Work
Analytics, machine learning and a bit of web engineering. Code is on GitHub and Kaggle.
Kaggle notebook
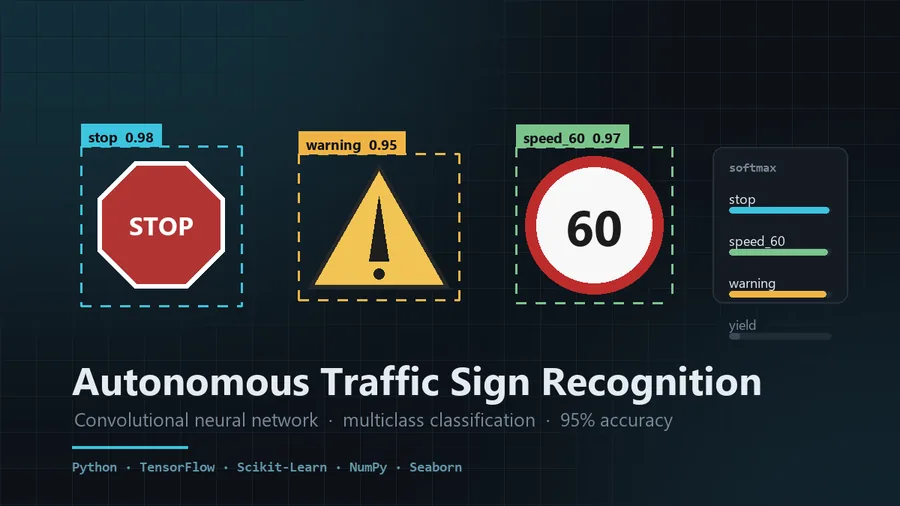
A convolutional neural network for multiclass traffic sign classification, reaching 95% accuracy through image preprocessing, data augmentation and hyperparameter tuning. Evaluated with confusion matrices and per-class metrics.
Open source
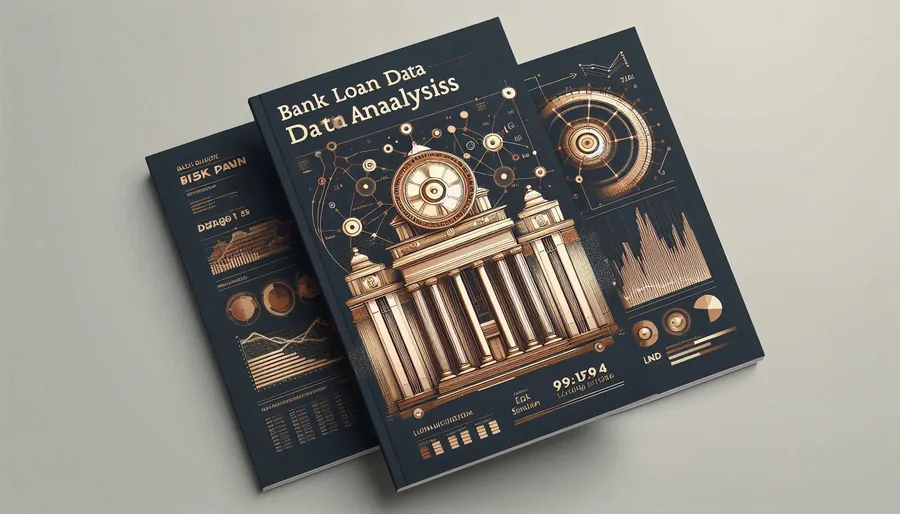
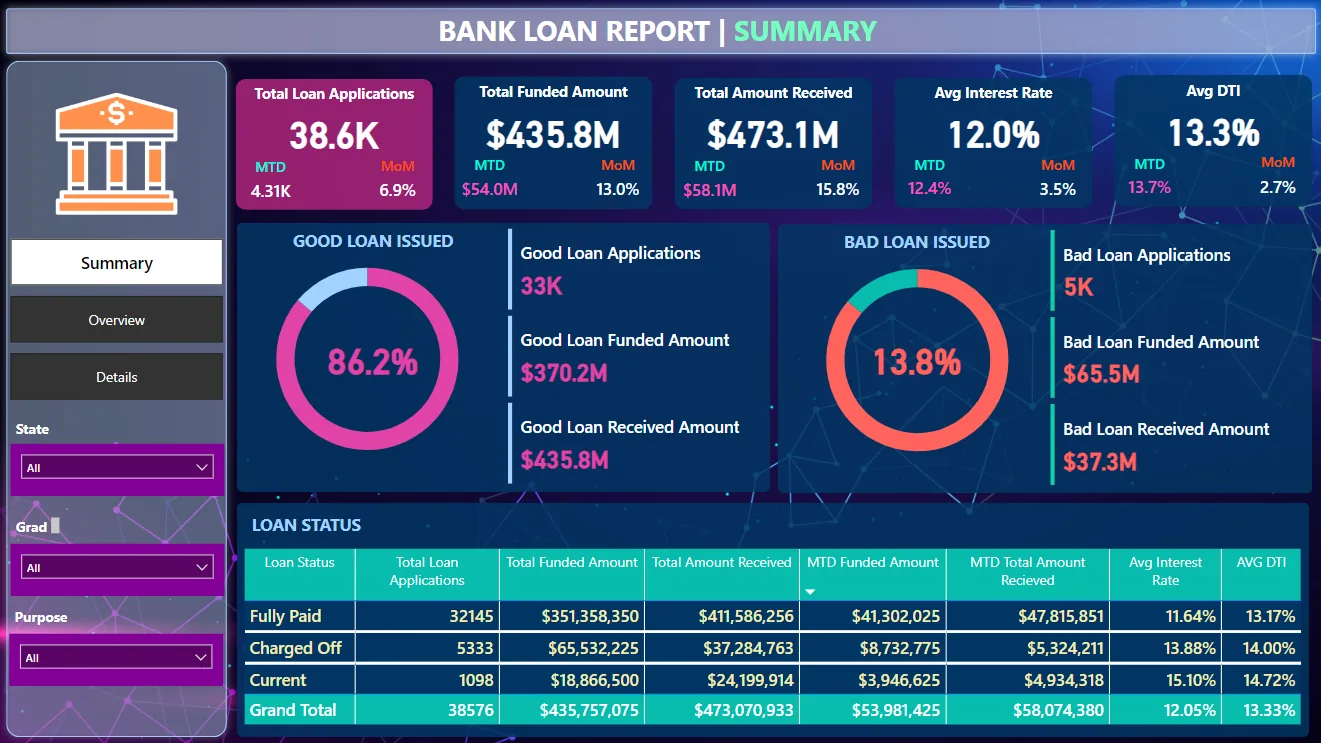
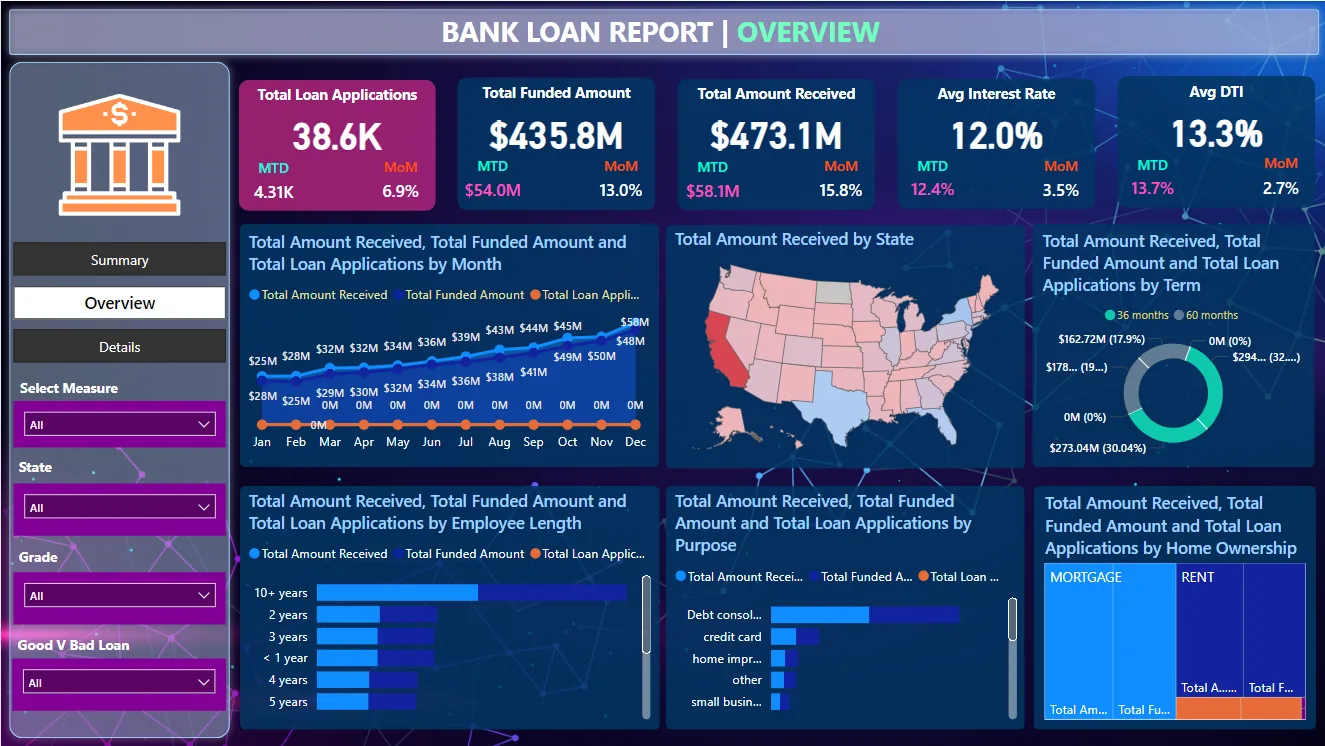
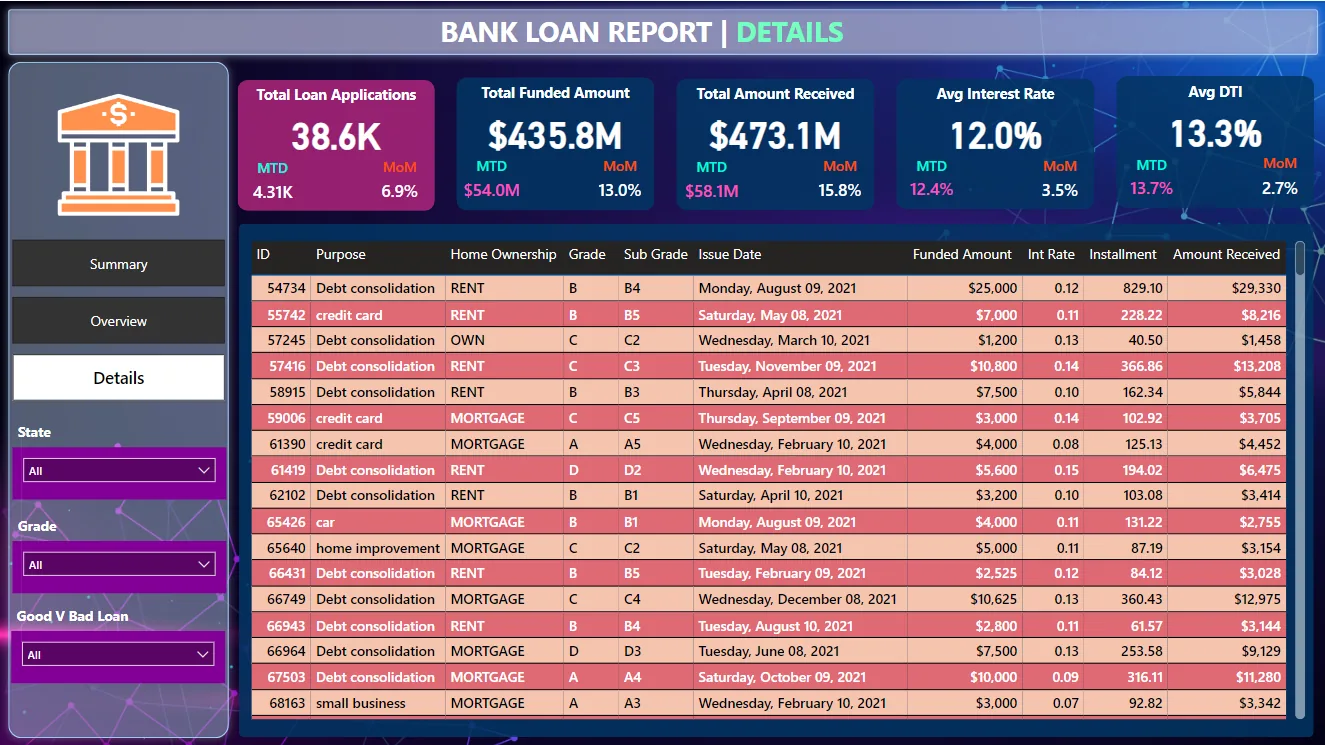
SQL-based analytical pipelines feeding an interactive Power BI dashboard for loan portfolio risk: approval rates, default exposure and portfolio performance KPIs. The recurring reporting is automated, replacing manual spreadsheet consolidation.

Open source
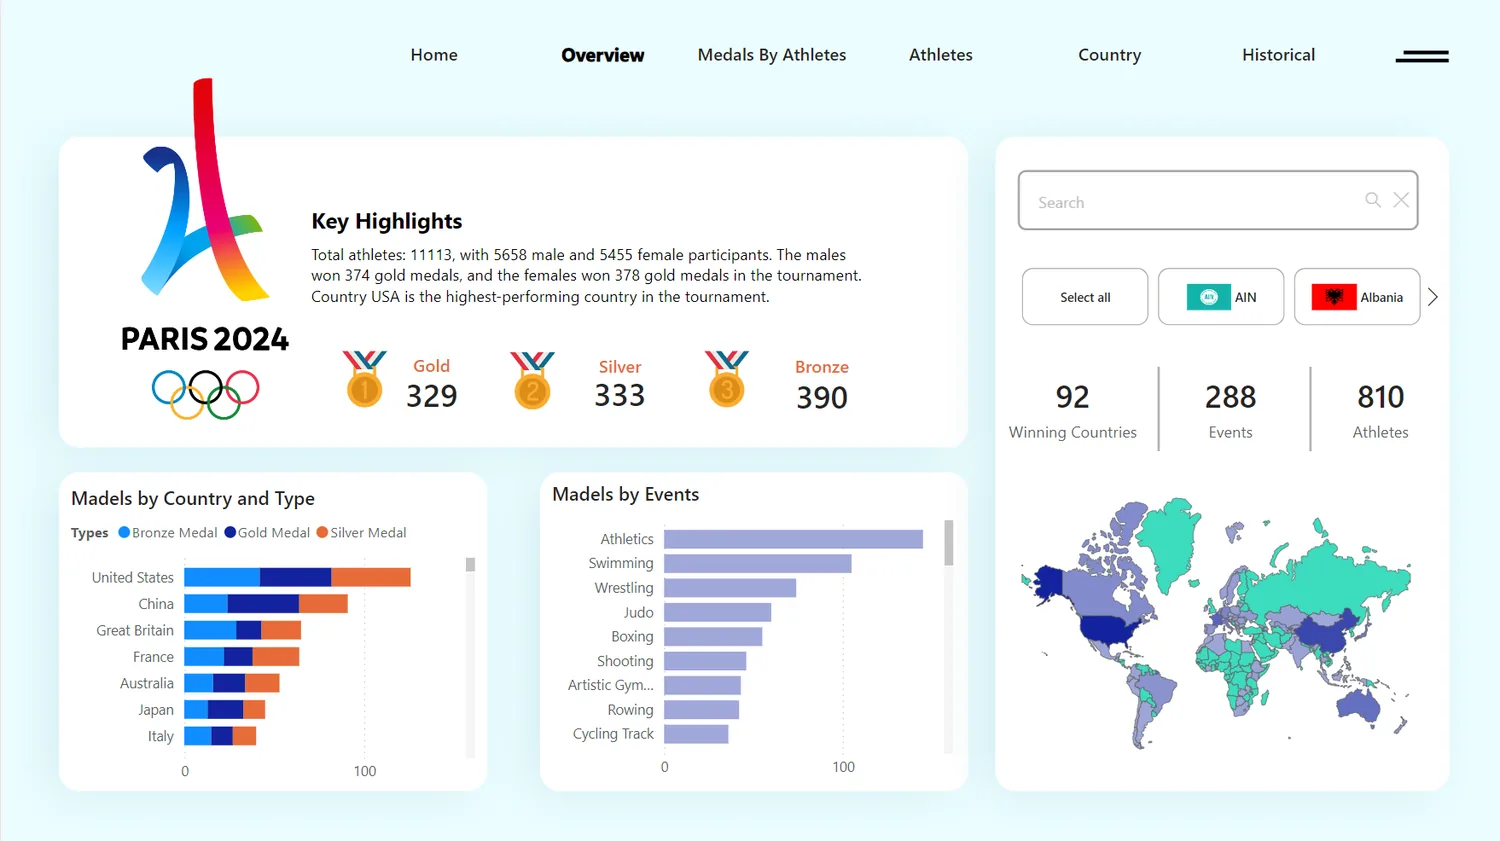
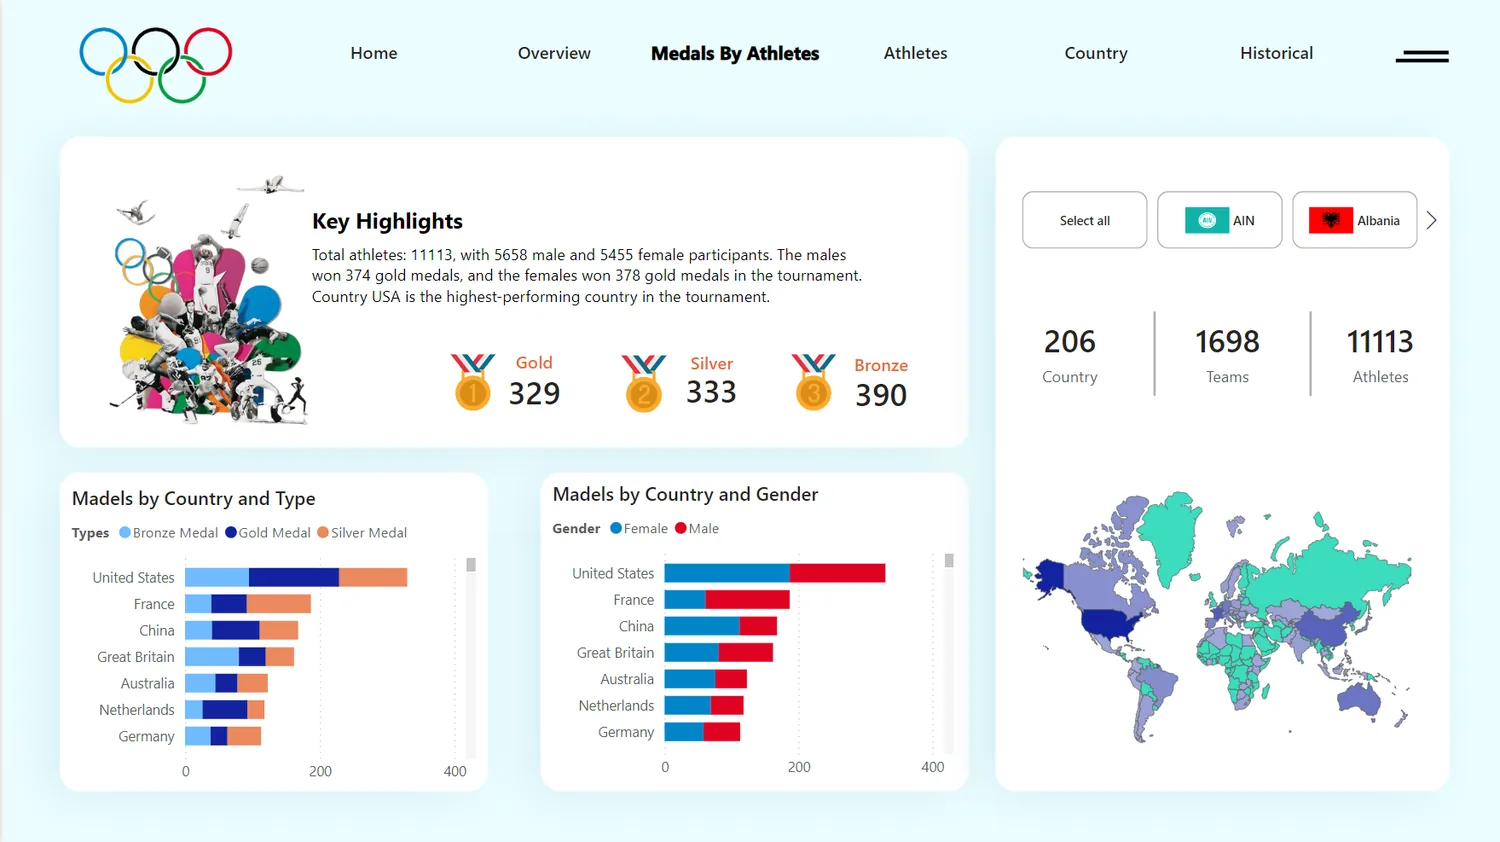
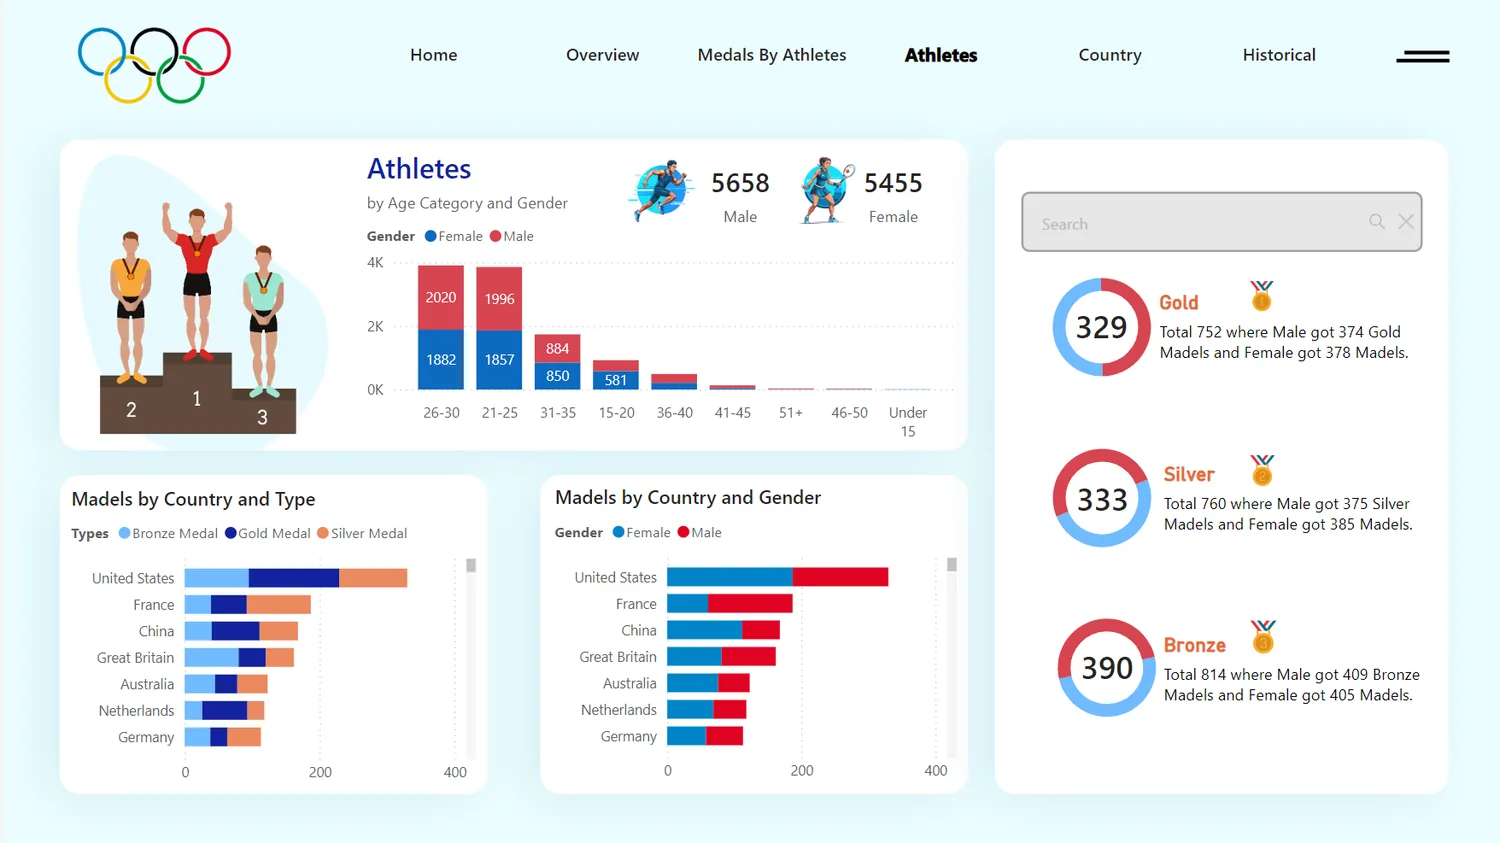
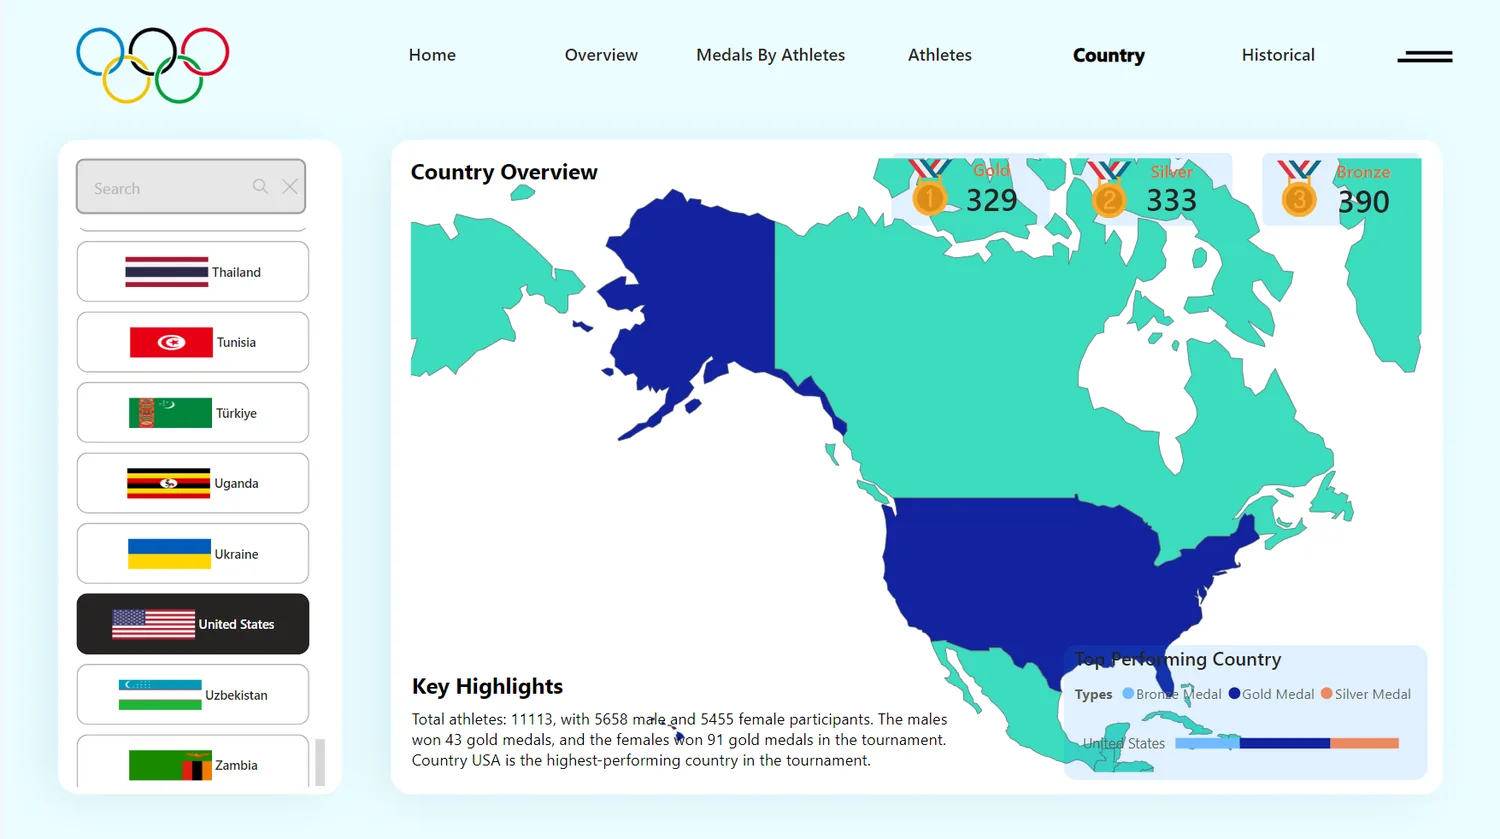
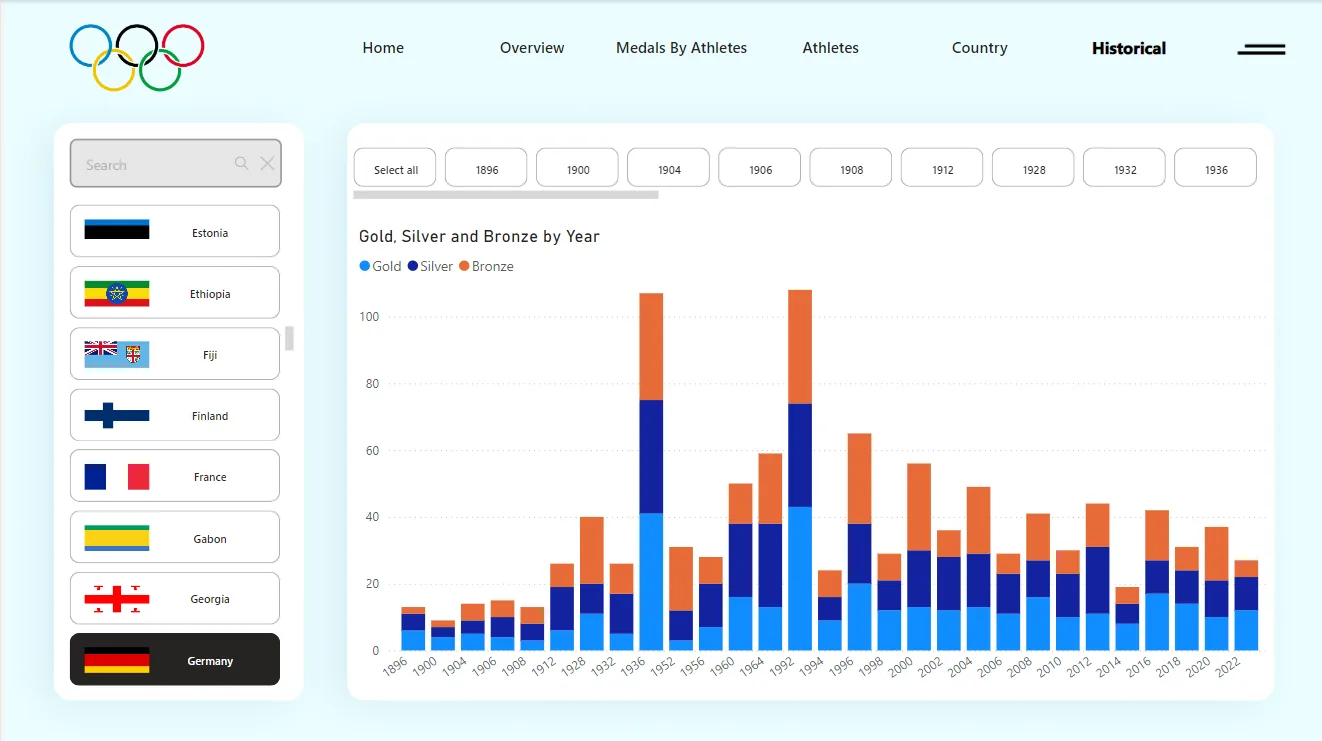
Athlete, event and medal tables for the Paris 2024 Games cleaned in Python and modelled into a single Power BI report, with DAX measures for medal counts by country, sport and discipline.
Open source
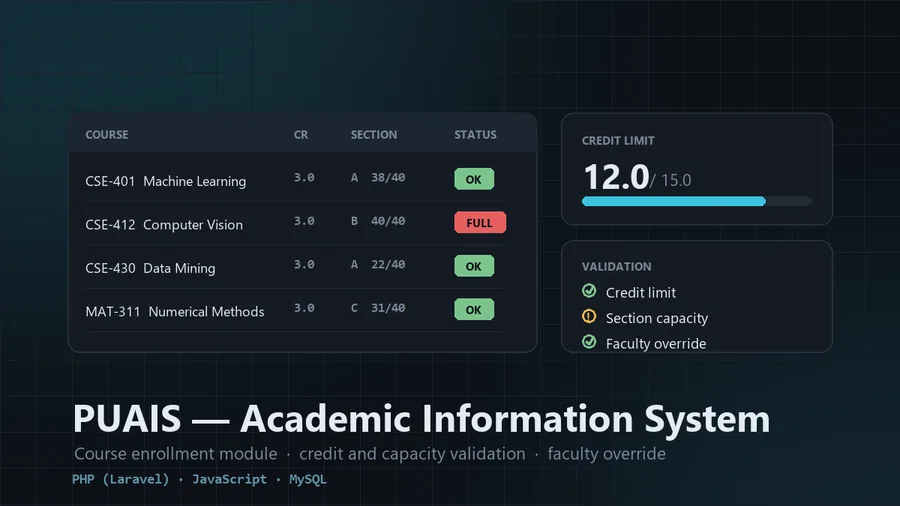
The course enrollment module for the Premier University Academic Information System, with automated validation of credit-limit and section-capacity constraints, real-time notifications and faculty override support.
Open source
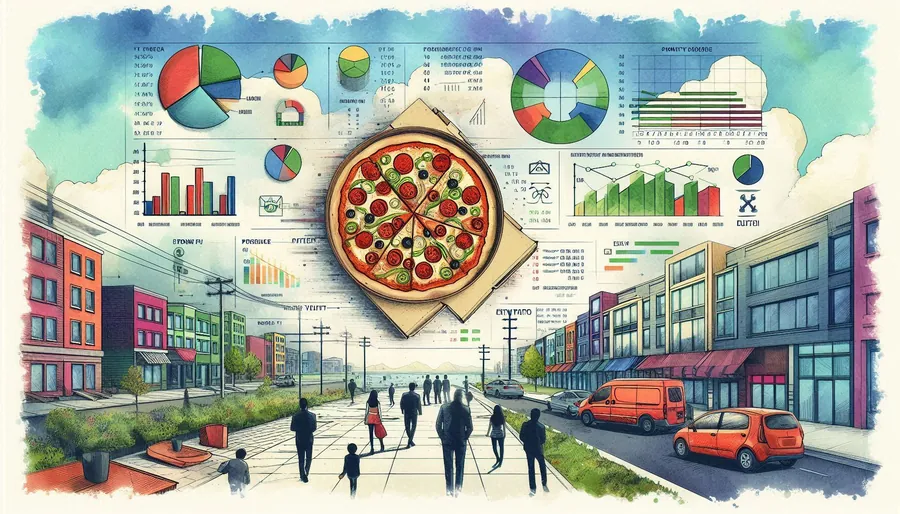
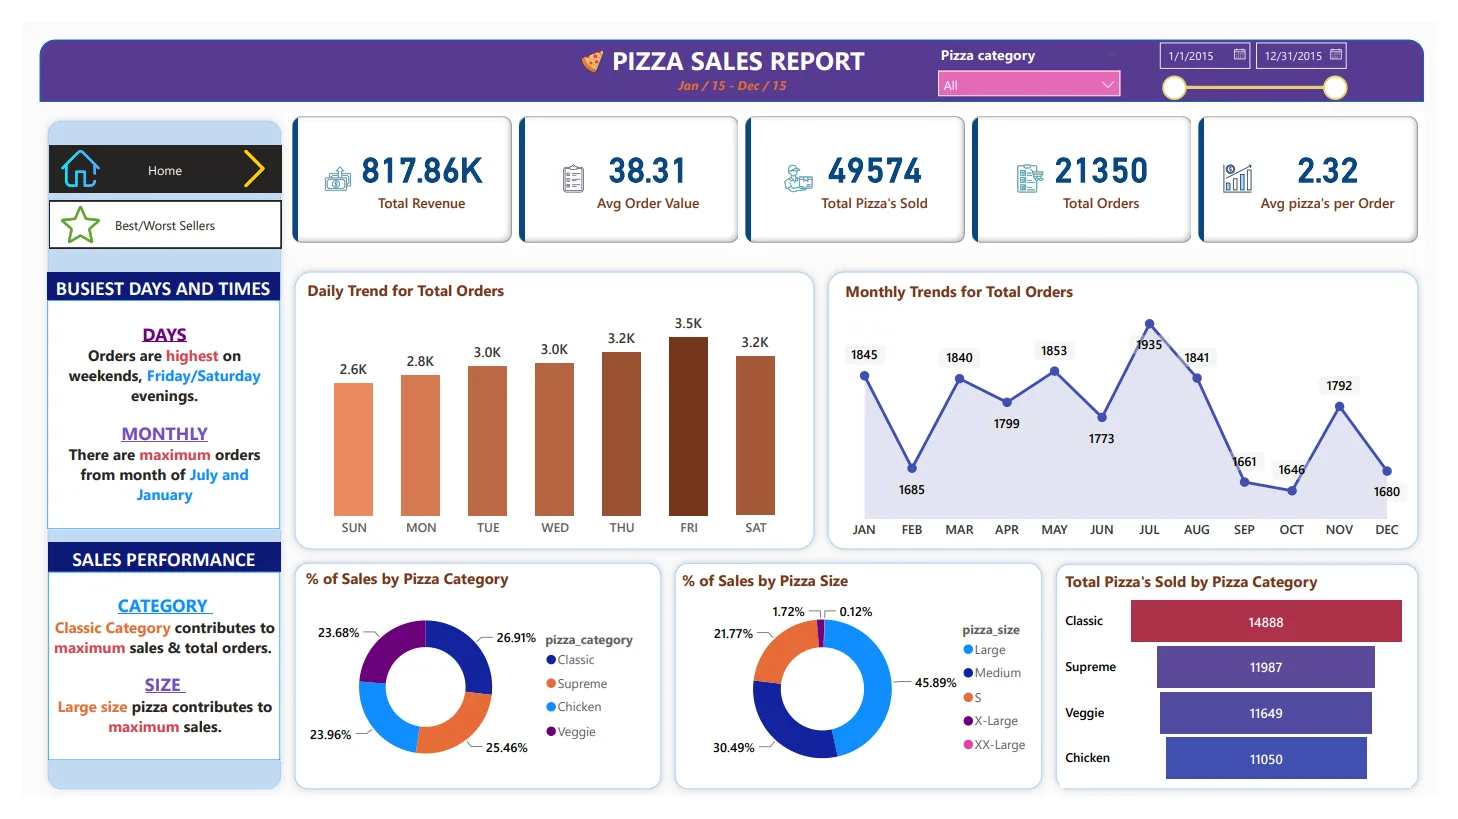
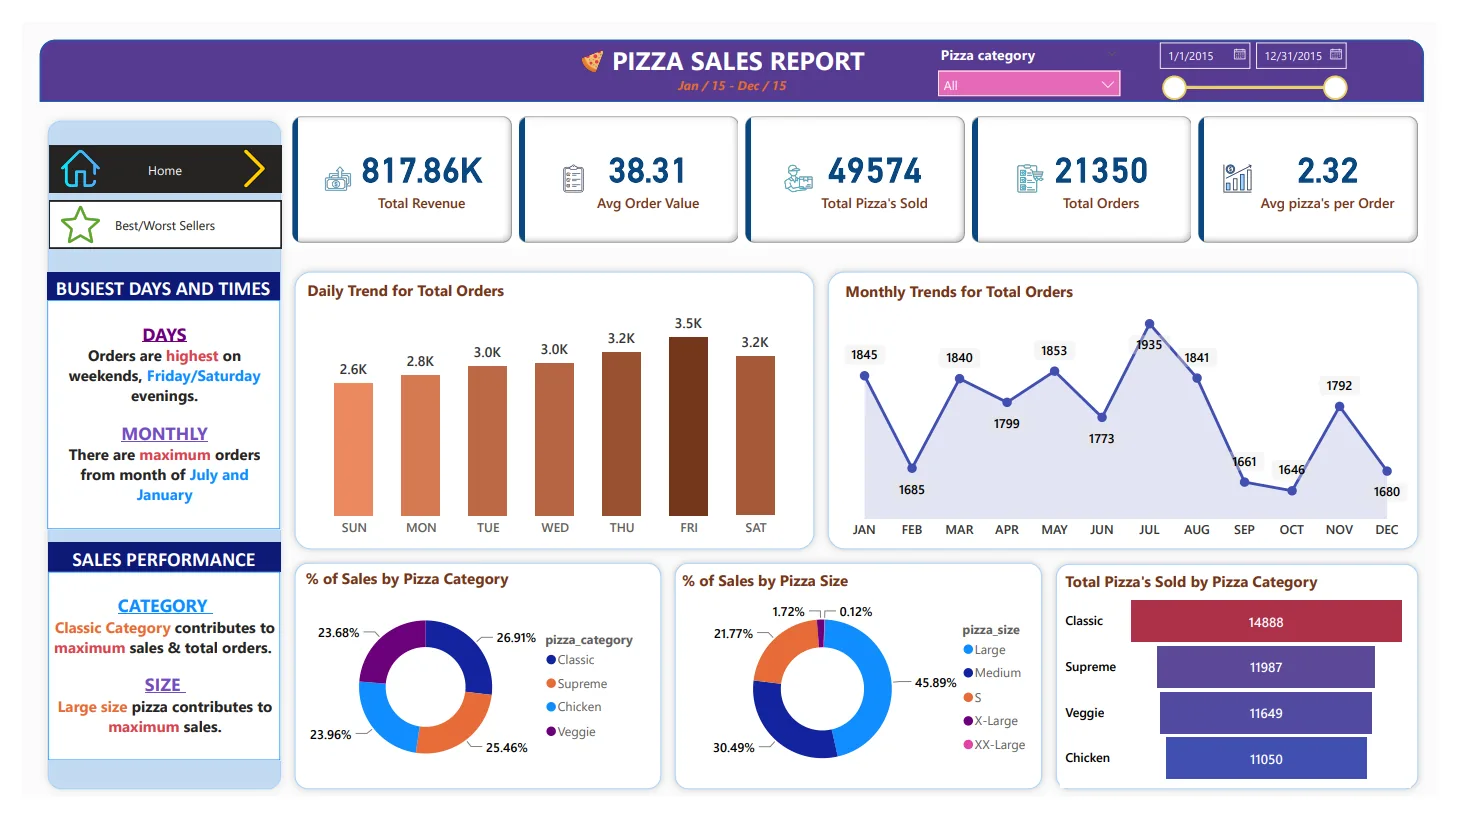
Order-level sales data queried in SQL Server, then a Power BI dashboard covering revenue, order volume, average order value, busiest hours and days, and best and worst sellers by category and size.

Open source
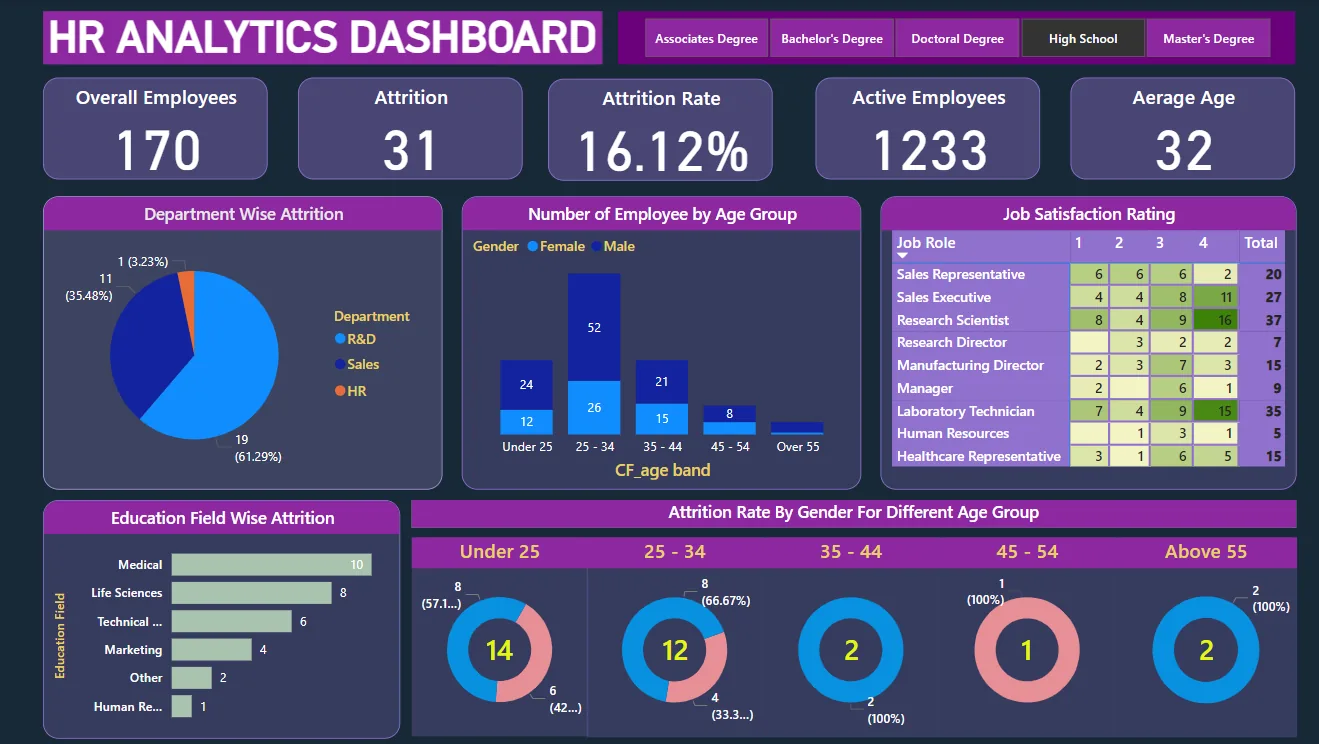
Employee data reshaped in Power Query and turned into an attrition dashboard: headcount, leaver rate and the breakdown by department, age band, salary band and years of service.
Nothing in that area yet.
Smaller experiments, practice datasets and the raw report files all live there.
Browse the repositoriesEach video is sampled into a fixed-length frame sequence. A time-distributed MobileNetV2 extracts visual features per frame, those are flattened and fed to a bidirectional LSTM that learns the temporal pattern, and a dense layer with dropout makes the accident / non-accident call. Transfer learning does the heavy lifting on a dataset this small.
Three pages: a summary with the headline lending KPIs, an overview with the trend and regional cuts, and a details table. Every KPI was written first as a SQL query and then reproduced as a DAX measure, which made the numbers easy to check against each other.
The raw files came as separate athlete, event and medal tables. Python handled the cleaning and the joins; the model and every measure were built in Power BI with DAX. The report pages break medals down by country, sport and discipline.
The questions came first as SQL against SQL Server: total revenue, average order value, pizzas per order, and the busiest hours and weekdays. The Power BI pages then put those alongside best and worst sellers by revenue, quantity and order count, split by category and size.
Most of the work was in Power Query: the source spreadsheet had inconsistent categories and a few unusable columns. Once it was clean the report shows headcount and attrition rate, then cuts them by department, age band, salary band and years at the company.
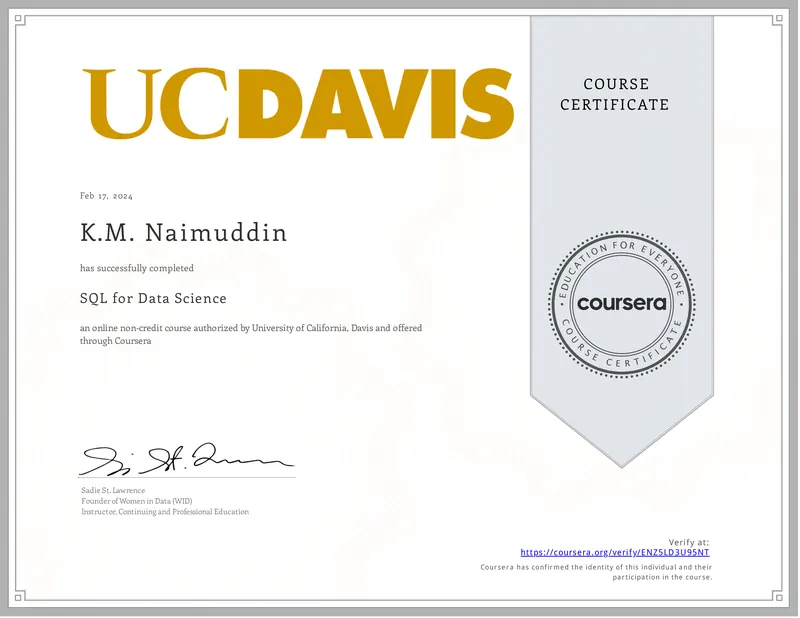
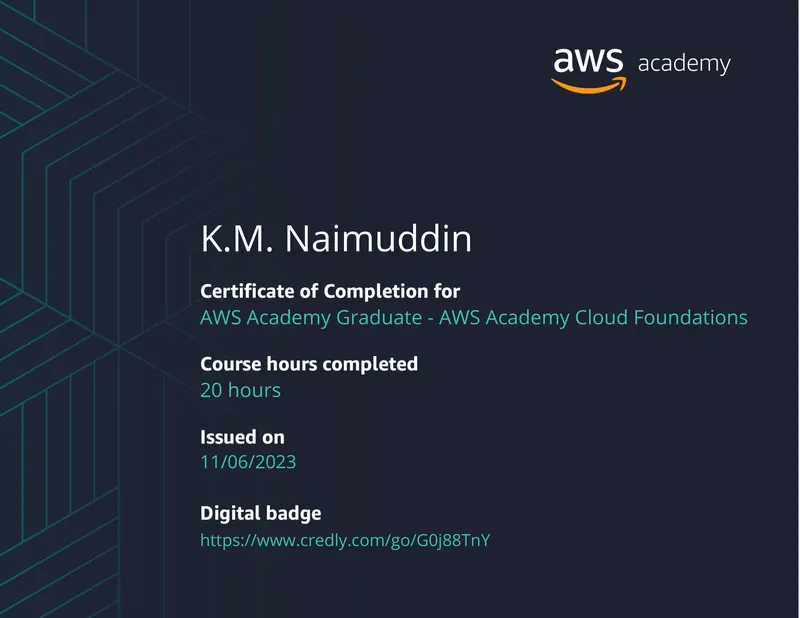
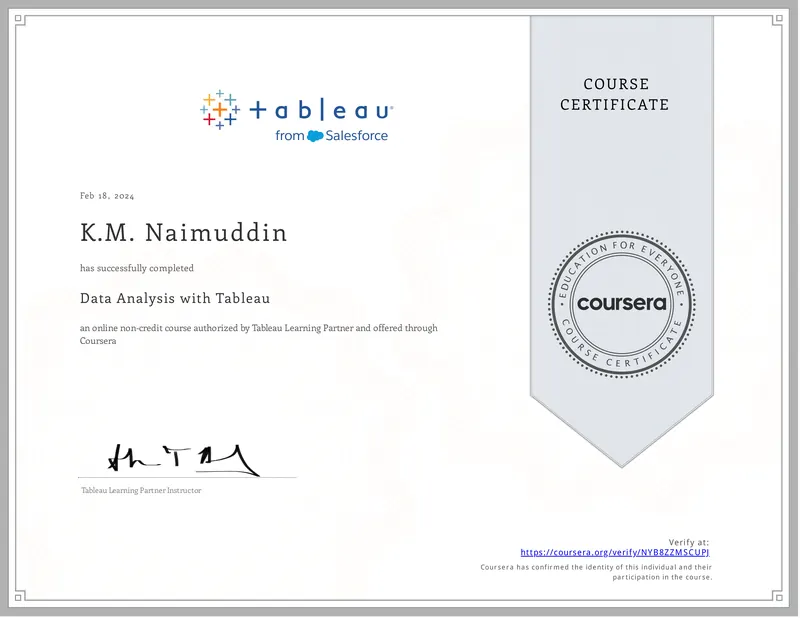
Credentials
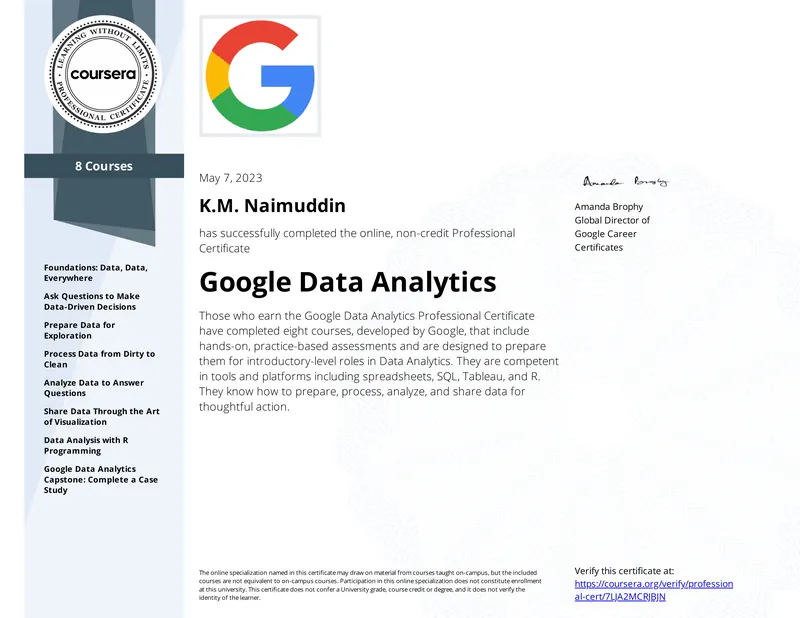
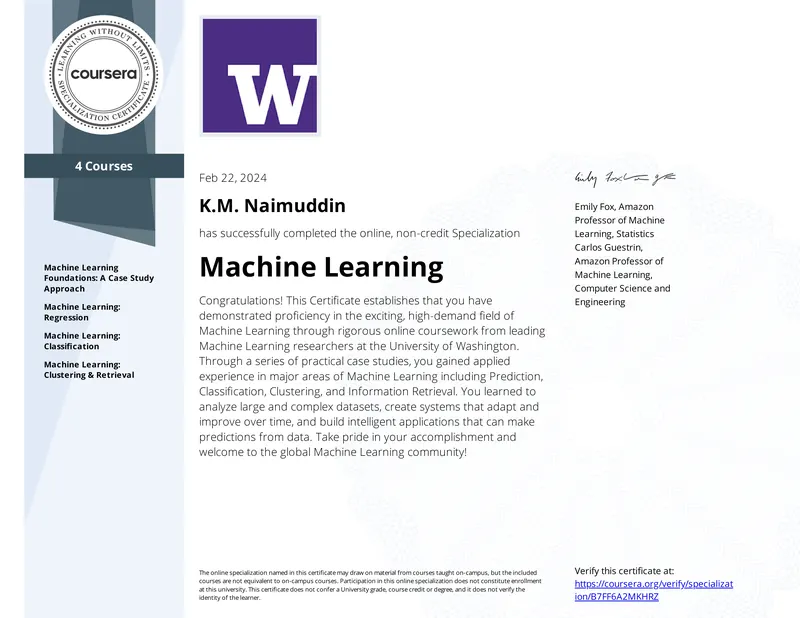
Every entry links to its verification page.


Data Analytics Bootcamp 3.0
Codebasics
Certificate link needed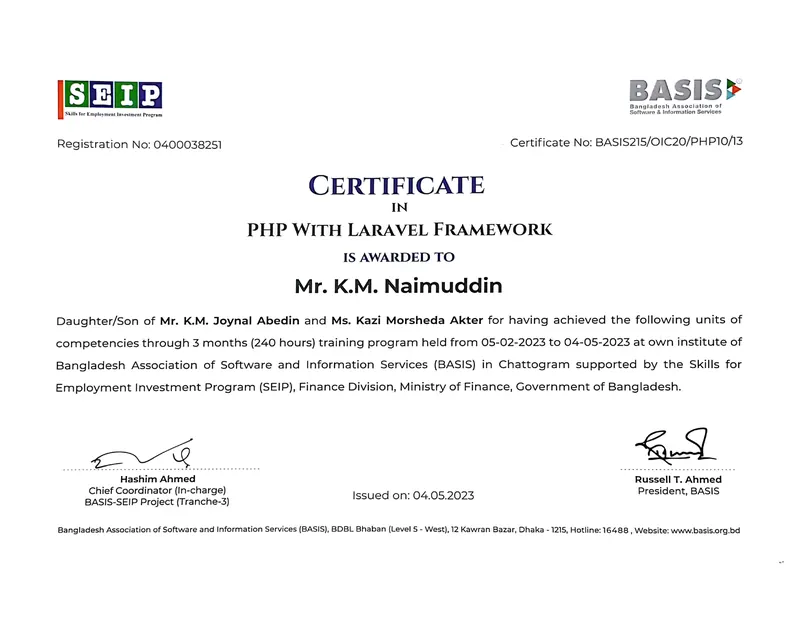
PHP with Laravel
BASIS Institute of Technology & Management
Public link needed
Professional English Communication
WSDA · Grade A+
Public link neededReferences
Contact details are on request rather than in public.
Prof. Dr. Shahid Md. Asif Iqbal
Professor & Associate Dean, Faculty of Engineering
Premier University
Mohammad Hasan
Assistant Professor, Dept. of CSE
Premier University · Moderator, Programming Wing, PU Computer Club
Tusar Karmoker
Assistant Program Manager
ServiceEngine Limited (SEBPO)
Contact
Email is the fastest way to reach me.
Naim's assistant
Answers from this page